1. Historical Data
Historical Data is the time-range archive view of Realtime Data. It lets you query all past records for a specific device within a chosen time window, displayed as either a trend chart or a data table. Use it for trend analysis, anomaly tracing, and raw data export.
Data Flow
flowchart LR
    DEV[LoRaWAN Device]:::dim
    GW[Gateway]:::dim
    NS[NS Data\nRaw MAC frames]:::dim
    AS[AS Data\nDecrypted structured payload]:::dim
    RT[Realtime Data\nThing-model values]:::dim
    HIS[Historical Data\nTime-range archive]:::highlight

    DEV -->|Radio signal| GW
    GW -->|SEMTECH UDP| NS
    NS -->|LoRaWAN decrypt| AS
    AS -->|Thing model parser| RT
    RT -->|Persist| HIS

    classDef highlight fill:#1a6fcf,color:#fff,stroke:#1a6fcf
    classDef dim fill:#f0f0f0,color:#888,stroke:#ddd
Historical Data is sourced from the same persisted records as Realtime Data. If Realtime Data is empty for a device, Historical Data will be empty too.
1.1. How to Access
In the Realtime Data list, click the History Data button at the end of a device row to open that device's historical query page.
1.2. Chart View
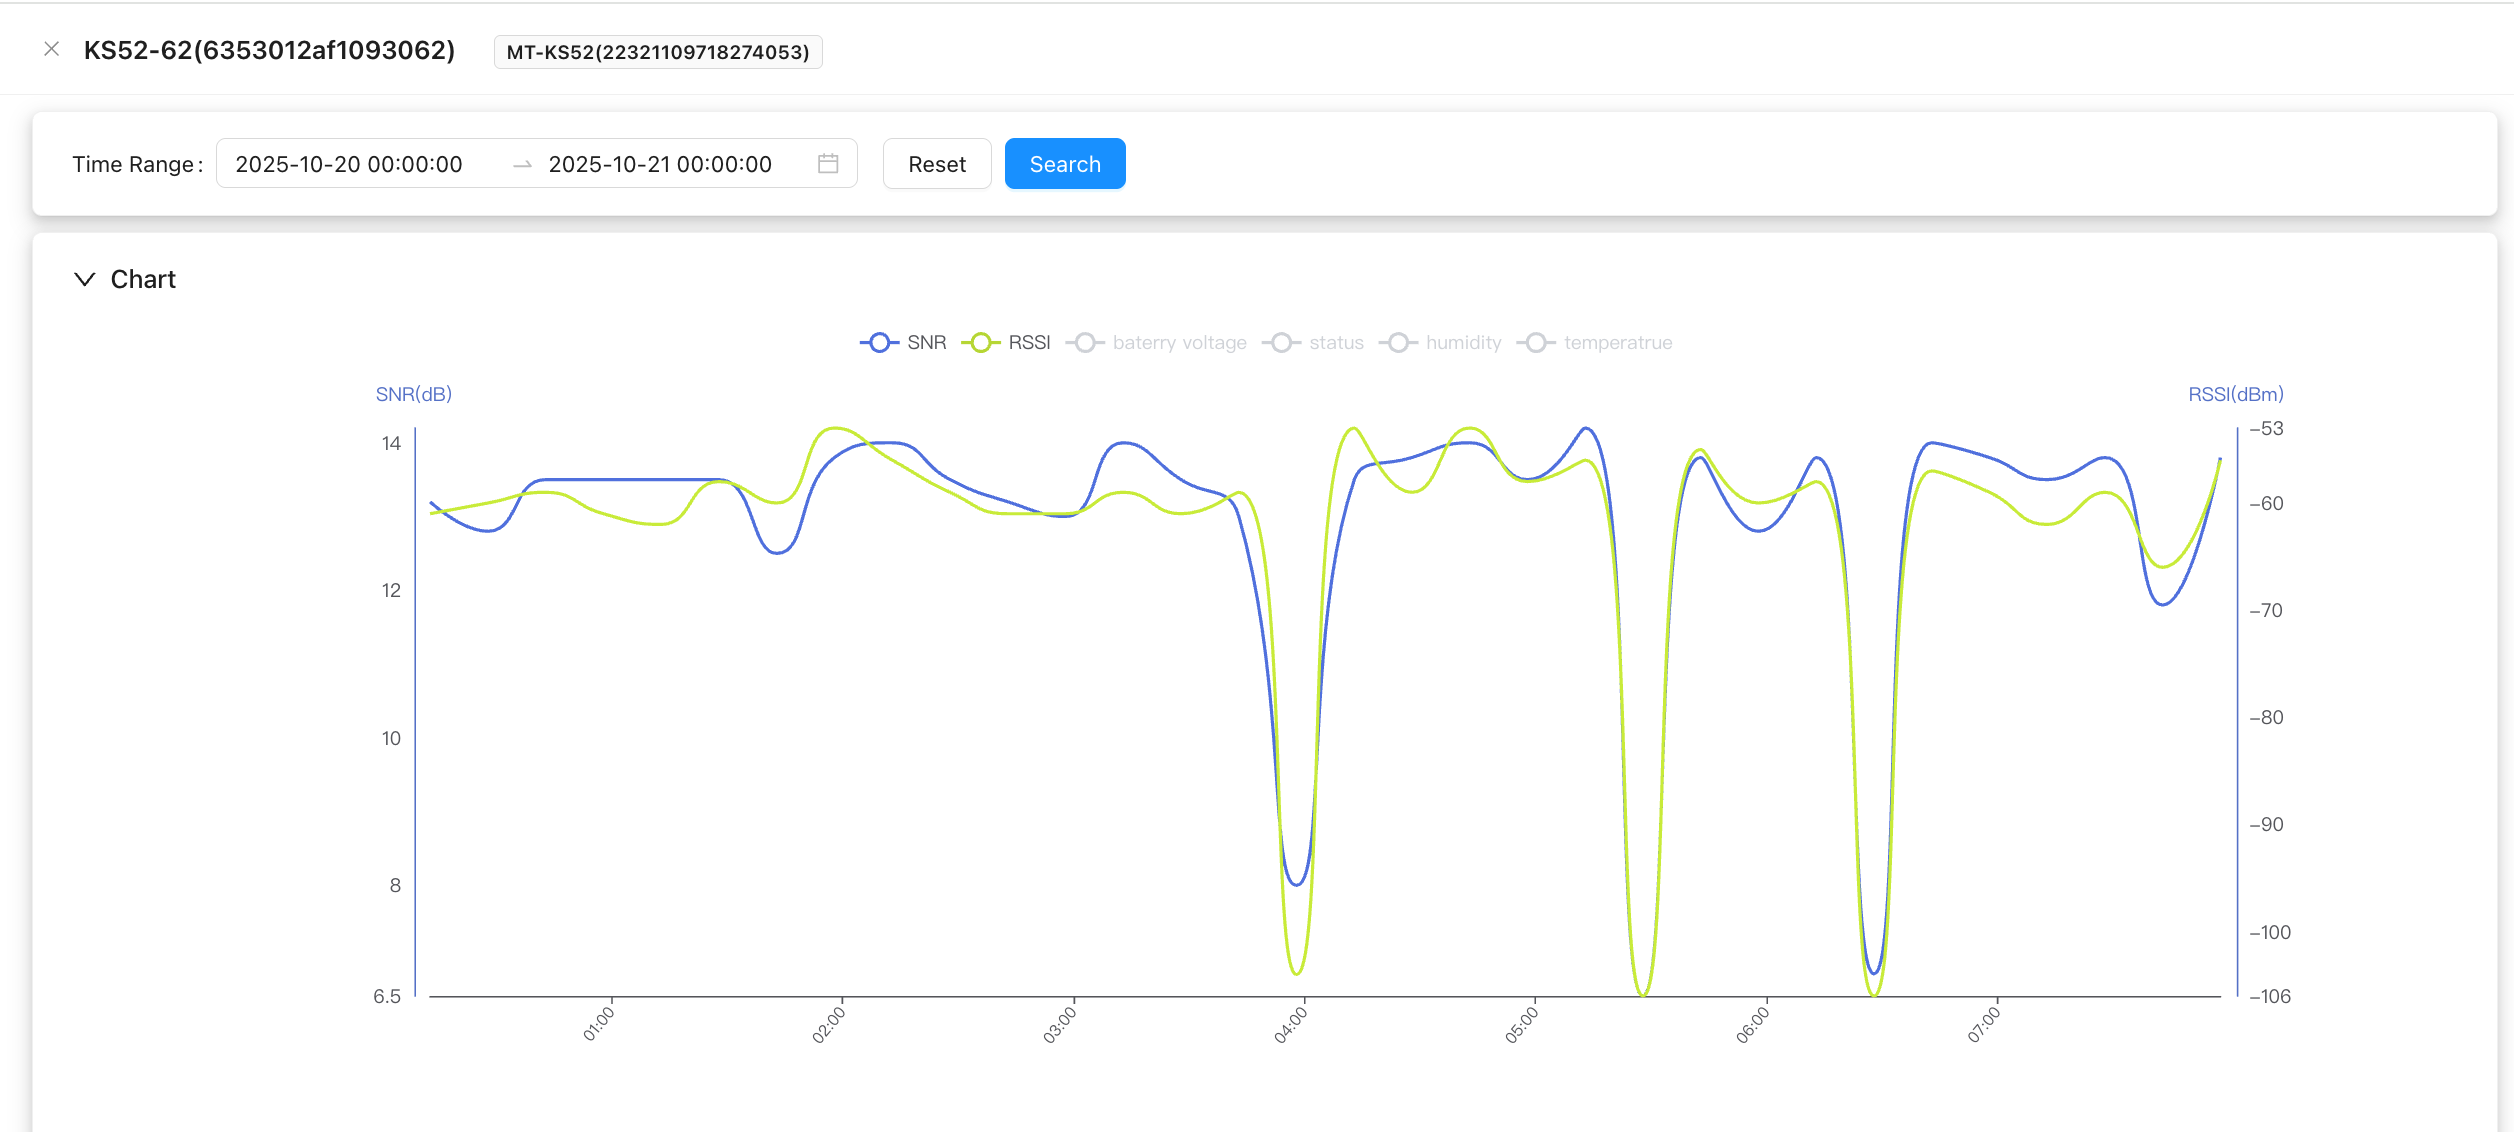
Displays each selected property as a line chart over the chosen time range. Toggle individual properties on or off using the checkboxes above the chart.
1.3. Table View
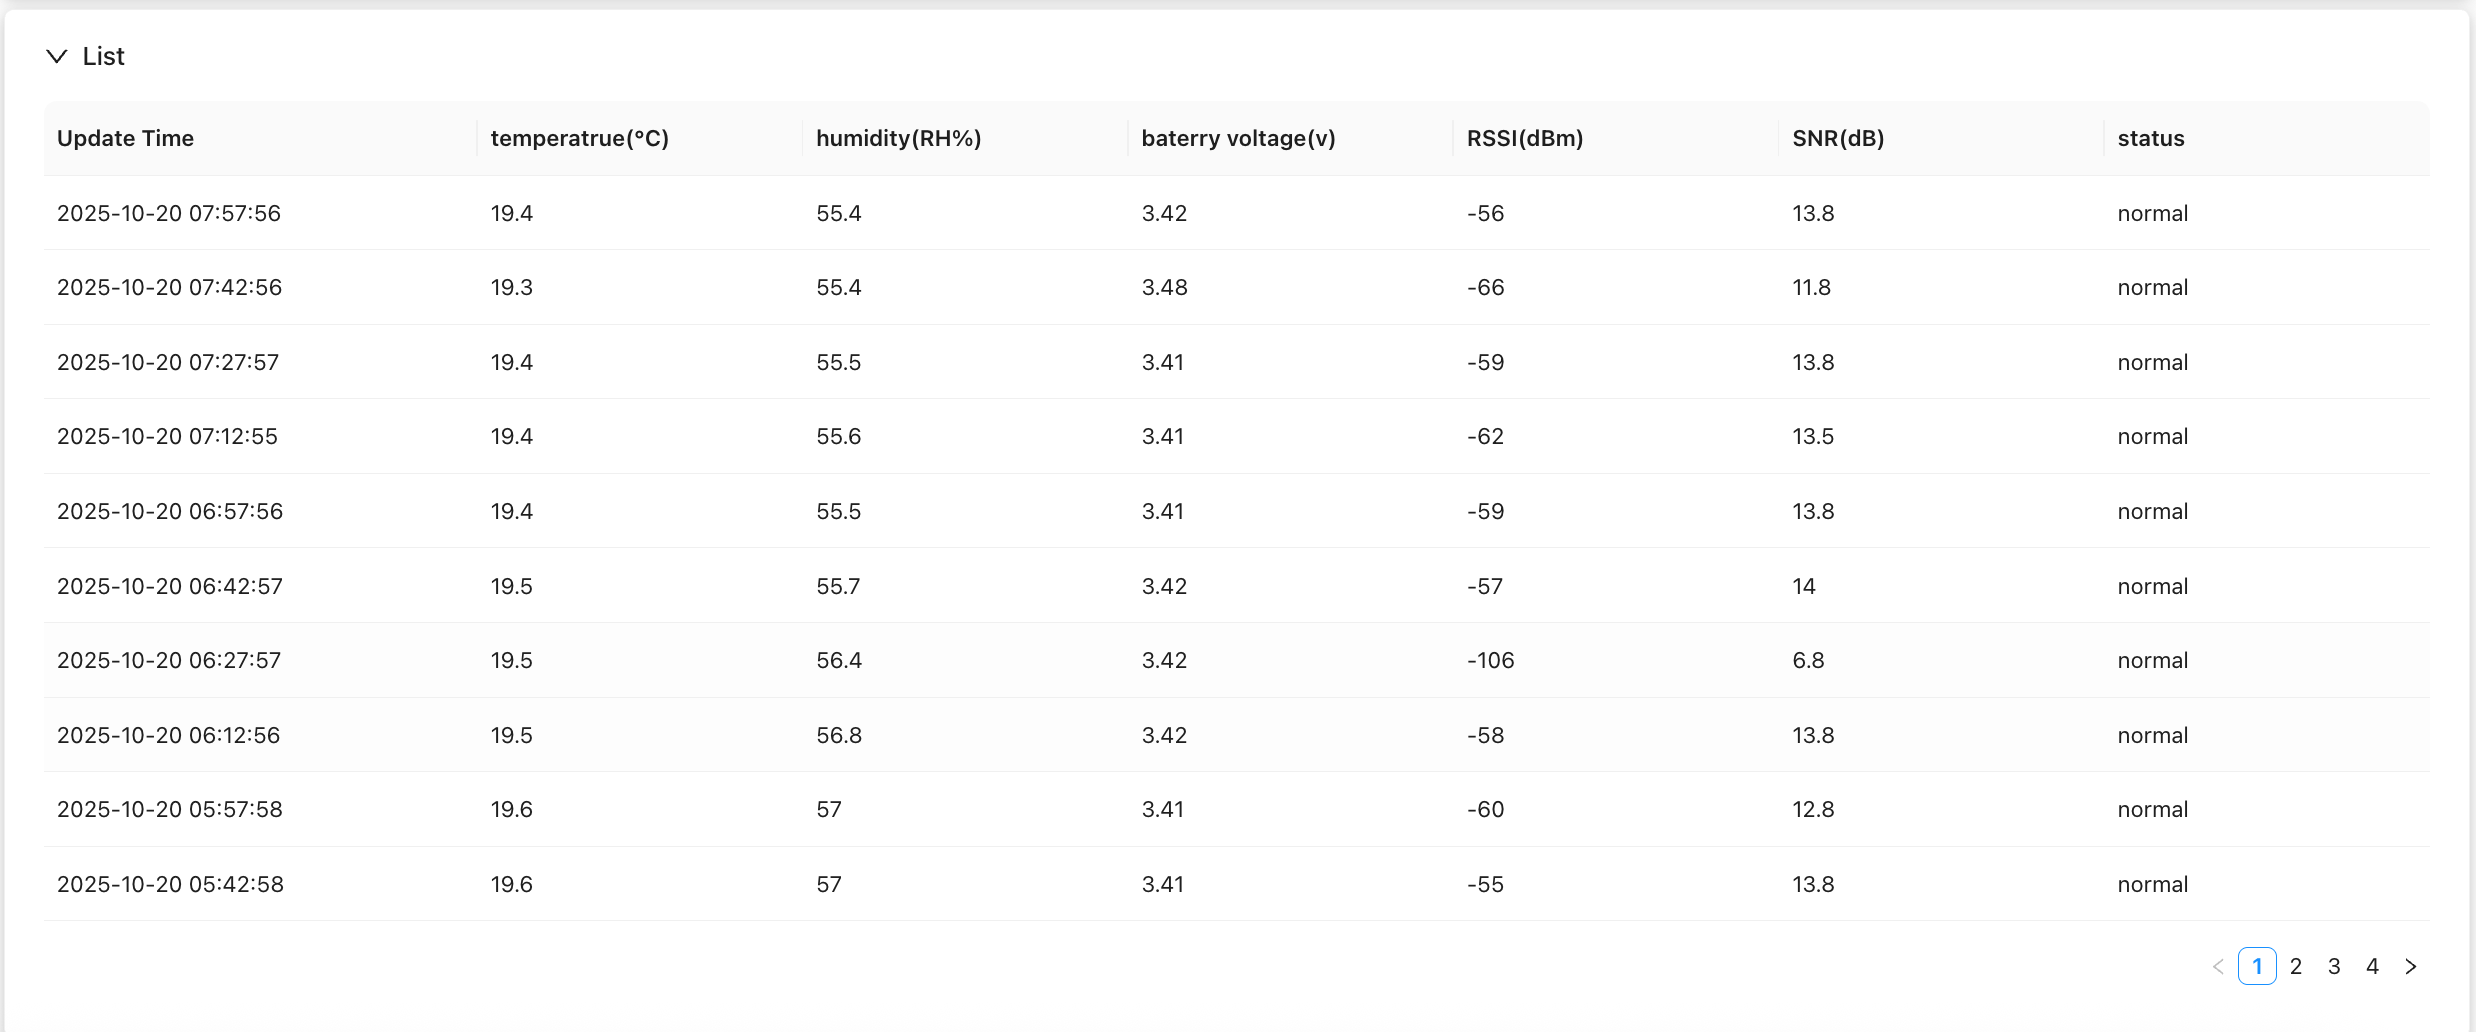
Lists every record in chronological order with all property values per row. Useful for precise point-in-time lookup or exporting raw data.
1.4. Query Tips
- Time range: Keep single queries under 7 days — large result sets slow down page rendering.
- Property filter: Hiding unused properties in chart view improves render speed.
- Data gaps: If records are missing for a period, check NS Data to confirm whether uplinks were received during that window.